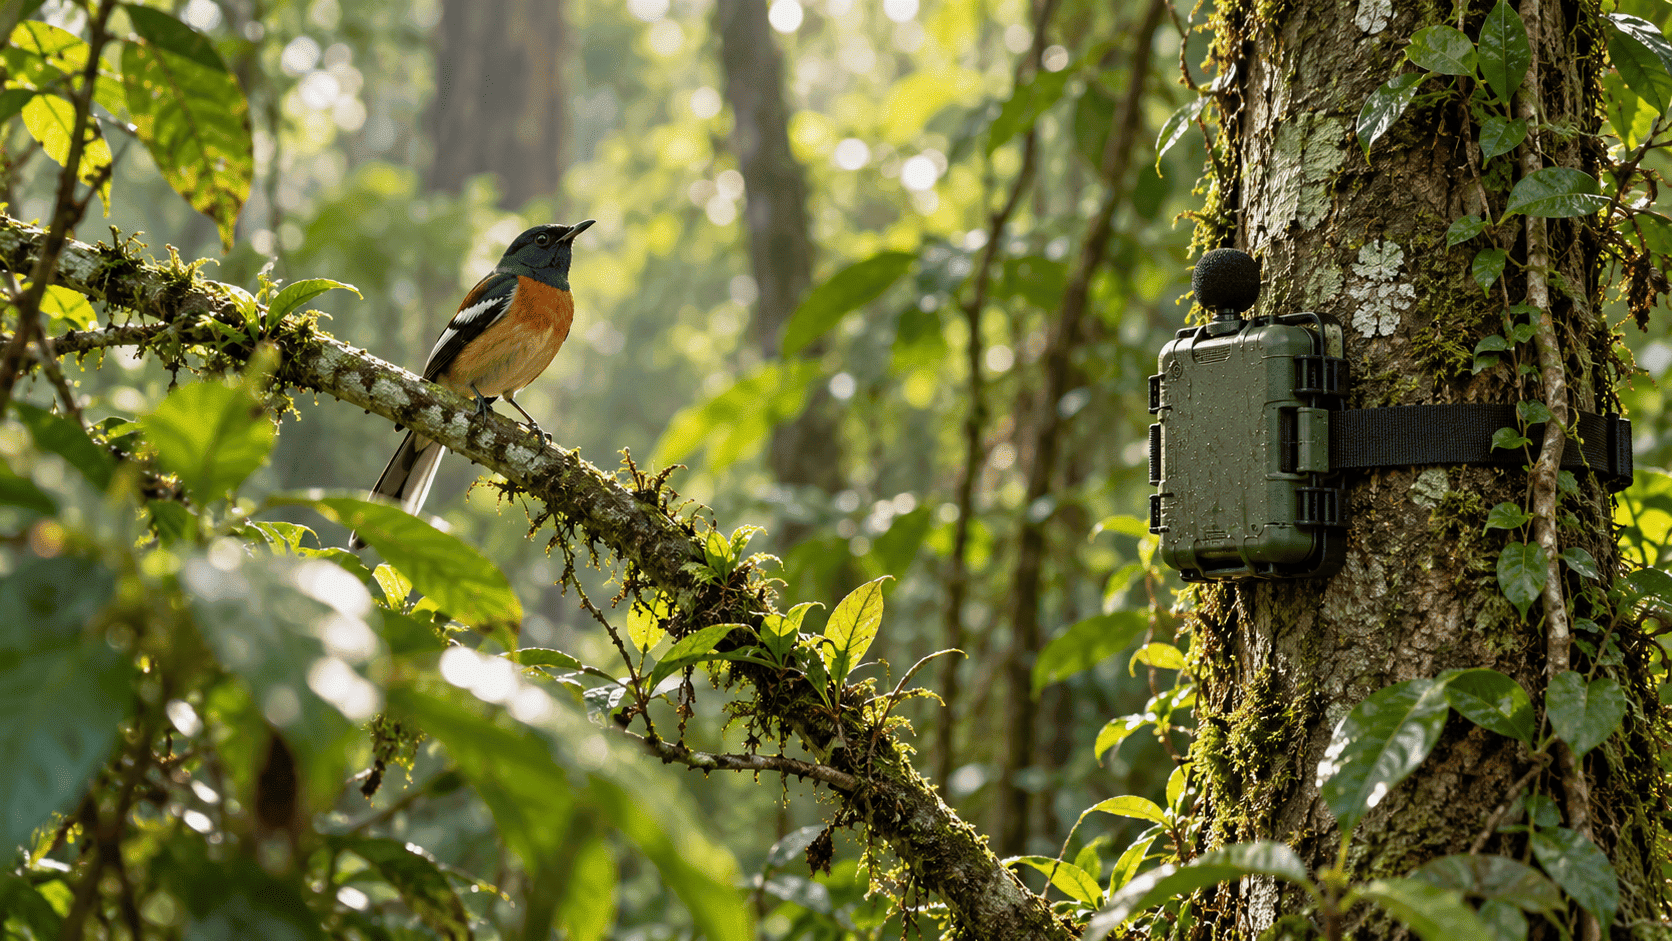
Bioacoustic is the Continuous Ecological Monitoring (CEM) application. Recorders left in the field listen for birds, BirdNET names the species in every short window of audio, and the app turns those detections into views for monitoring spots, species and the monitoring network.
Detections are cleaned before anyone reads them. Rain and noise are filtered out, unreliable species are dropped, and the result feeds soundscape indices, daily activity patterns, migration checks and a test of whether birds follow the sun. The full method is under Methodology.
4stratified monitoring sites in the study
3 saudio window named by BirdNET
6,000+species the classifier knows
How to use it
1
Open the app: Launch the Bioacoustic (CEM) application. It opens on a map of monitoring spots.
2
Pick a spot: Select a monitoring spot on the map to see what was heard there, including how many species were noticed.
3
Look at species: Switch to the species view to see which birds were detected.
4
See the network: Open the network view to see how the monitoring spots fit together.
5
Know what you are reading: Open Methodology on this page to see how recordings become detections and how detections become indices, regularity and migration results.
Watch it in action
Pipeline walkthrough
▷Tutorial coming soon
The walkthrough will appear here when it is available.
Continuous Ecological Monitoring
A walkthrough of Continuous Ecological Monitoring: monitoring spots, species and the monitoring network.
The video could not be loaded. Check your connection and try again.
Watch it in action
Pipeline walkthrough
▷Tutorial coming soon
The walkthrough will appear here when it is available.
Continuous Ecological Monitoring - Public view and listen analysis network
Public catalogue API, static master website, PostgreSQL catalogue, and background indexer for Continuous Ecological Monitoring.
The video could not be loaded. Check your connection and try again.
Methodology
How Continuous Ecological Monitoring Works?
From field audio to bird-activity metrics · BirdNET detection · five-step filtering · acoustic indices
1RecordSong Meter 2, four sites, 2 min on / 4 min off
2Pre-processSegment, denoise, flag rain
3DetectBirdNET, 3-second windows
4FilterFive steps, two clean datasets
5AnalyseIndices, AR, HA, migration, solar
Where it runs
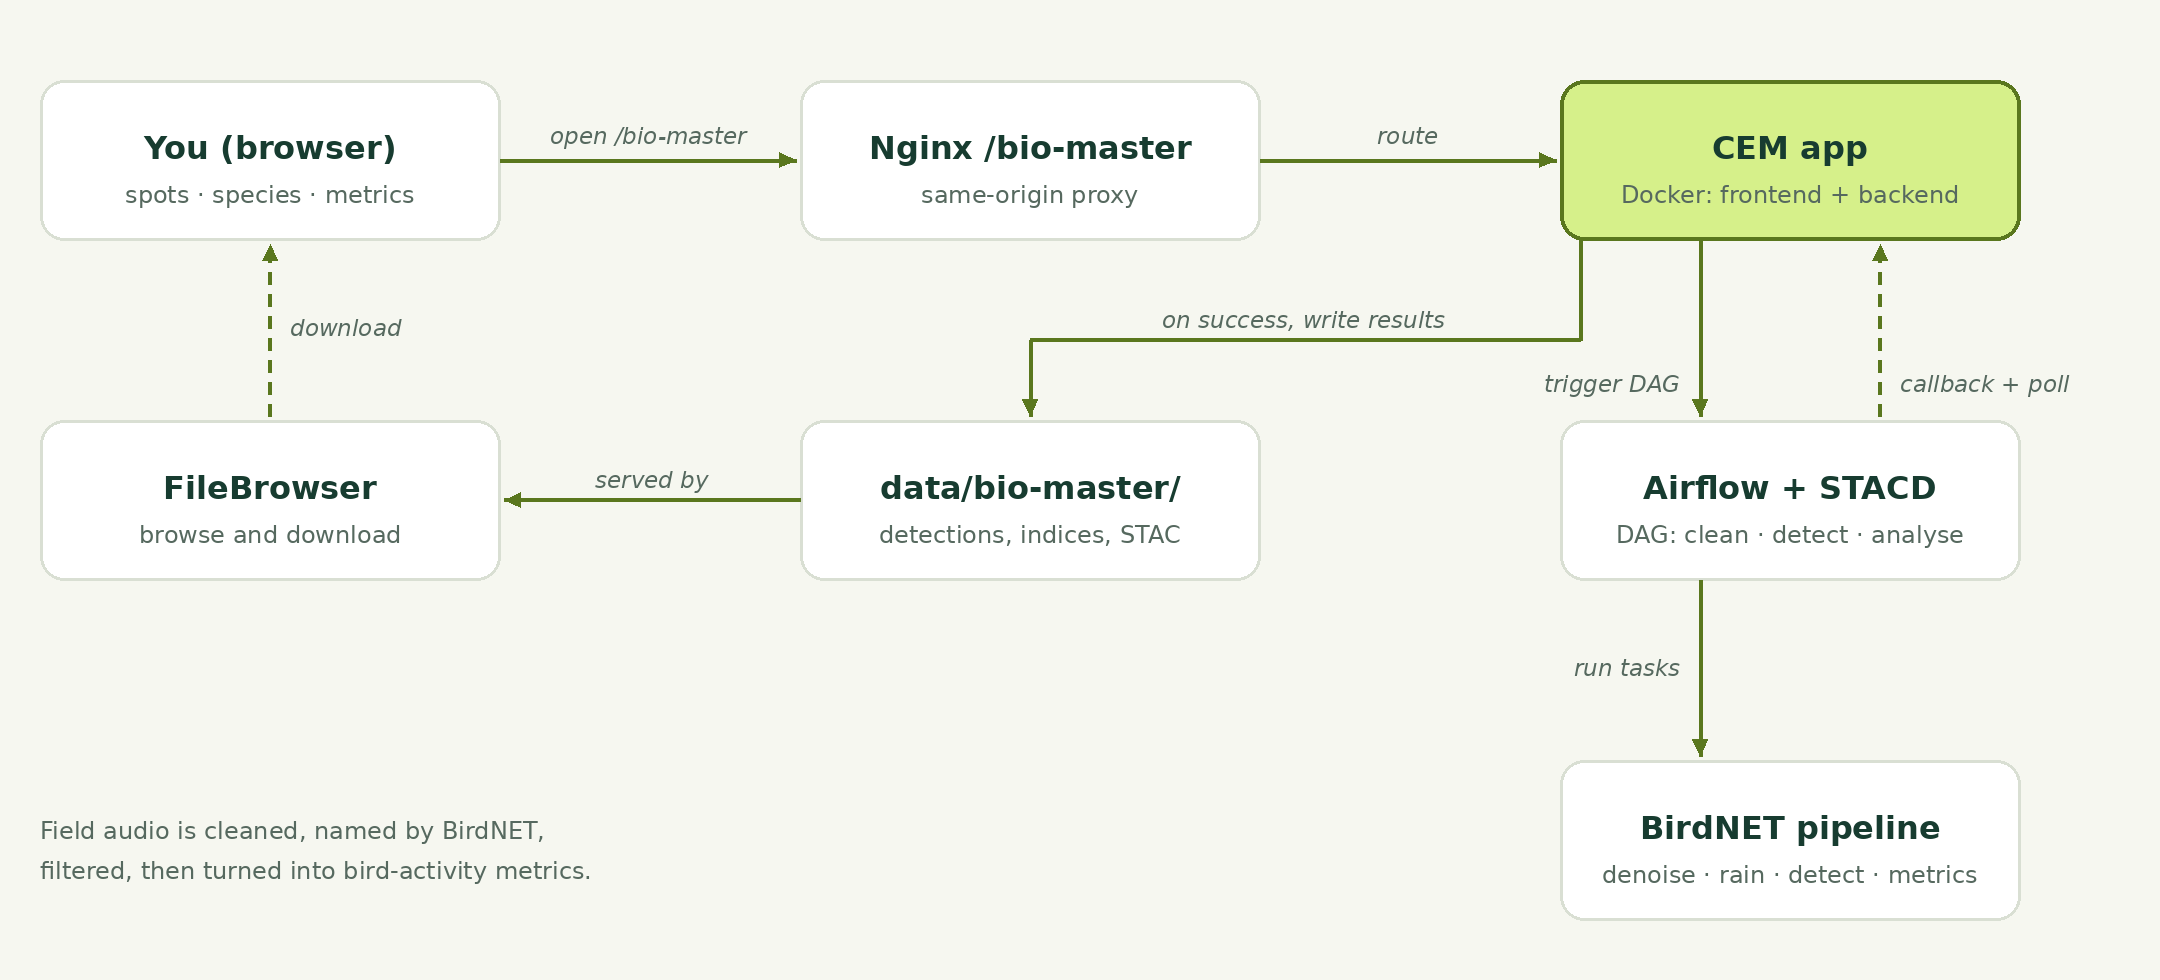
CEM is a Docker app (frontend + backend) behind Nginx at /bio-master. The browser only talks to the app.
Long processing goes to the shared Airflow + STACD job runner. The app triggers the DAG and polls until it ends in success or failed.
On success, results are written under data/bio-master/ and can be browsed in FileBrowser.
Notation used throughout
Symbol
Meaning
s
a bird species
j
a recording location (site)
k ∈ D = {1, …, n}
a day in the study period
h ∈ H = {1, …, 24}
an hour of the day
cs,j,k,h
The number of detections of species s at site j on day k during hour h. Every metric below is a sum or a correlation over this one quantity.
1 · Study design
Four stratified sites at Sanjay Van, Delhi NCR, chosen to differ in vegetation composition, canopy structure and habitat, so comparisons across sites mean something.
Song Meter 2 recorders, placed to maximise ambient sound capture and minimise anthropogenic noise.
2:4 duty cycle: 2 minutes recording, 4 minutes sleep. Chosen from a pilot across sites with no measurable loss in species detection or index reliability, and a longer field life.
Full equipment specifications, recording parameters and placement details are in the paper's appendix.
2 · Pre-processing
Segmentation: each 2-minute file is one segment.
Tseg = 120 s, fs = 48,000 Hz
Noise reduction: SNR-scaled noise subtraction in the time domain plus spectral gating in the frequency domain, applied through a short-time Fourier transform.
STFT → spectral gate → iSTFT
Rainfall removal: heavy rain is broadband noise that inflates the Acoustic Diversity Index. A Random Forest on 40 MFCCs per 10-second chunk labels rain as None / Low / Medium / High, and High segments are dropped before indices are computed.
94.17%overall accuracy
0.96F1 on the Heavy class
3,012chunks from 251 files, 20% held out
Why it matters: without the rain filter, ADI produced false-positive biodiversity signals during the monsoon; with it, index values across the dataset were corrected.
3 · Detection: BirdNET
An open-source classifier from Cornell and Chemnitz, trained on more than 6,000 species.
Slides a 3-second window over each segment and returns, per window, a species and a confidence in [0, 1].
Published weights are used unchanged; nothing is trained here.
Every detection becomes one row in the project's aggregate.csv: species, confidence, file, site, date, hour.
cs,j,k,h = #{ d ∈ Ds : site j, day k, hour h }
The confidence floor is a generation parameter. It is set when BirdNET runs. A window below it is never written, so lowering the threshold later cannot recover it. Each site's effective floor is the maximum across its files, and it is recorded in the job log.
4 · Filtering: five steps to a reliable table
Step
Rule
1 Taxonomic verification
Keep only species on the regional eBird / Merlin checklist.
Sverified = { s ∈ Sraw : s ∈ SeBird }
2 Confidence threshold
Drop low-confidence windows.
Dfiltered = { d ∈ Ds : conf(d) > 0.3 }
3 Minimum activity
A species needs enough detections overall.
Cs = ∑j∑k∑h cs,j,k,h > 10
4 Temporal consistency
And enough days with substantial activity.
Ks = | { k : Cs,k > 10 } | ≥ 5
5 Rainfall removal
Heavy-rain segments excluded before index computation (see Pre-processing).
Cs,k is the daily total for species s, summed over sites and hours.
Dataset
Steps and use
Quality-filtered
Steps 1–3. The default for every analysis: indices, regularity and affinity.
Temporally filtered
Steps 1–4. Used where day-to-day structure matters: migration and solar alignment.
5 · Acoustic indices: the soundscape without species
ADIAcoustic Diversity Index
ADI = −∑i=1N pi log pi, pi = Ei / ∑j=1N Ej
Shannon entropy of energy across N frequency bands. Higher = energy spread evenly, typical of many vocalising species.
ACIAcoustic Complexity Index
ACI = ∑t=1T−1 |S(f,t+1) − S(f,t)| / ∑t=1T S(f,t)
Frame-to-frame change in amplitude, averaged over bins. High = rapid modulation, like birdsong; low = steady noise.
AEIAcoustic Evenness Index
AEI = 1 − G, G = ∑i∑j |Ei − Ej| / (2N ∑i Ei)
Complement of the Gini coefficient of band energy. Penalises one band dominating.
NDSINormalized Difference Soundscape Index
NDSI = (EBio − EAnthro) / (EBio + EAnthro)
Biophony (2–11 kHz) against anthrophony (1–2 kHz). −1 is all traffic, +1 is all birds and insects.
Urban masking. At Sites 2 and 3 a high AEI did not mean a balanced soundscape but white-noise saturation from distant traffic. NDSI is what penalises that; no single index is read alone.
6 · Activity Regularity and Habitat Affinity
The same idea twice: correlate consecutive days. AR asks when a bird calls; HA asks where. Both use the quality-filtered dataset.
ARActivity Regularity: same hourly schedule day to day?
The busiest day against a typical day. Large = extreme spikes relative to normal activity.
Decision rule
migratory ⇔ SCIs > τSCI ∧ Ks > τK ∧ PMRs > τPMR
Thresholds were set by inspecting species with known migratory behaviour, so the criteria separate the two groups cleanly. Everything else is resident.
The silent resident. Coppersmith Barbet scored SCI = 0.97 because it only calls in May. eBird sightings showed it present but silent, so a call-to-sighting check is needed before calling anything a migrant.
8 · Solar alignment: do birds follow the light?
Correlate each day's peak calling hour with that day's sunrise or sunset, on the temporally filtered dataset.
Solar events are in decimal hours, from site coordinates (φ, λ). Peak hour is taken in each window, Hmorning = {5…9} and Hevening = {17…20}.
The lags ΔT are expected to stay constant if light drives the bird. Correlation is over days with a detection in that window.
Result
Reading
High ρ(m)
Peak morning calling tracks sunrise as it shifts through the season: dawn drives the bird.
High ρ(e)
The same for dusk.
Low ρ
Peak timing is set by something other than light: food, weather, competition.
Limitations and what they imply
Limitation
What it means
Acoustics hears calls, not birds
A silent bird is invisible. Seasonal vocal patterns can make residents look migratory; eBird sightings are used as a cross-check.
The confidence floor is permanent
Detections below the run's threshold are never written. Sites processed at different thresholds have different floors, flagged in the index.
Timestamps come from filenames
Date and hour are read from SPOT_YYYYMMDD_HHMMSS names. A file that breaks the convention keeps its detections but loses its place in time.
Urban noise distorts indices
Traffic hum inflates AEI; rain inflates ADI. Both are handled (NDSI, the rain classifier) but neither correction is perfect.
Season length
SCI needs at least 60 days of recordings and the migration rule needs a full season; short deployments can only describe, not classify.
Thresholds are chosen, not learned
0.3 confidence, 10 detections, 5 days, and the migration τ values were set by inspection against known species, so they may need re-tuning for a new region.
Methodology by Mannat, Rajasree Ponnada and Yuvika Chaudhary, supervised by Prof. Aaditeshwar Seth, IIT Delhi.